Support » Pololu QTR Reflectance Sensor Application Note »
2. RC-type sensor output (intended for digital I/Os)
Each RC-type output is tied to a capacitor discharge circuit as shown below. Different QTR sensor products have different component values, and exact schematics for each QTR sensor can be found on its product page.
|
|
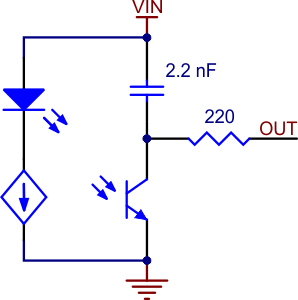
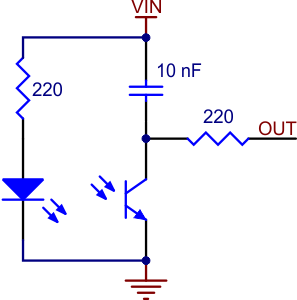
To use the sensor, you must first charge the output node by applying a voltage to the OUT pin. You can then read the reflectance by withdrawing that externally applied voltage on the OUT pin and timing how long it takes the output voltage to decay due to the integrated phototransistor. Shorter decay time is an indication of greater reflection. This measurement approach has several advantages, especially when multiple units are used:
- No analog-to-digital converter (ADC) is required
- Improved sensitivity over voltage-divider analog output
- Parallel reading of multiple sensors is possible with most microcontrollers.
When you have a microcontroller’s digital I/O connected to a sensor output, the typical sequence for reading that sensor is:
- Set the I/O line to an output and drive it high.
- Allow at least 10 μs for the sensor output to rise.
- Make the I/O line an input (high impedance).
- Measure the time for the voltage to decay by waiting for the I/O line to go low.
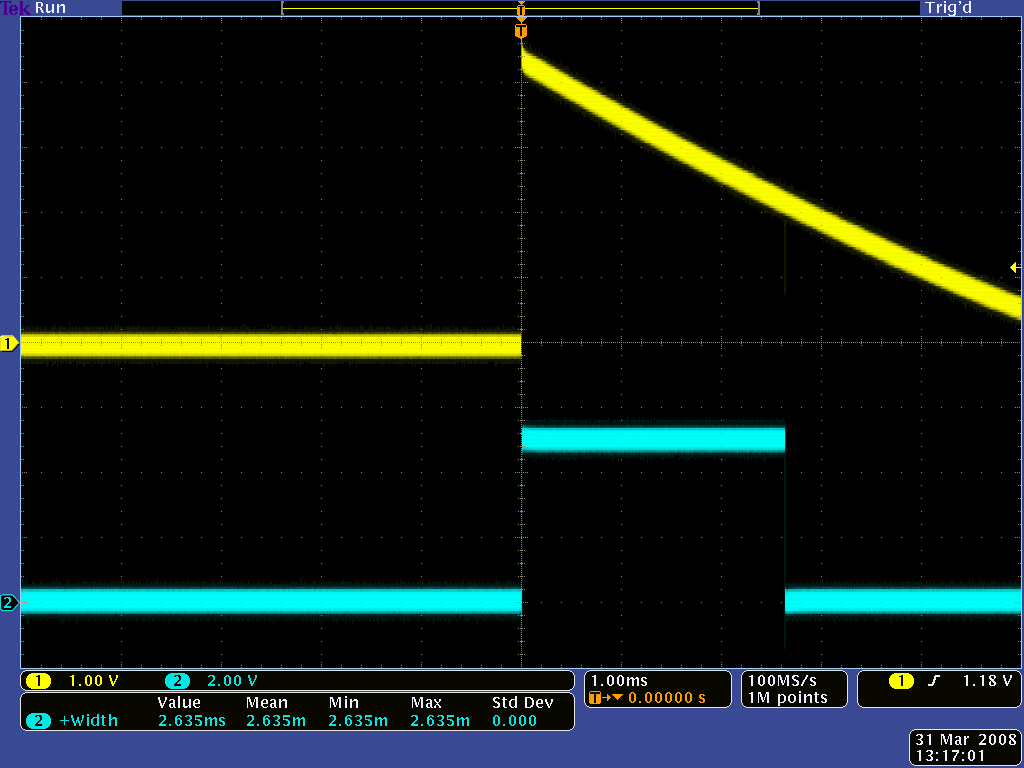
The following three oscilloscope screen captures below demonstrate the result of this procedure. A QTR-1RC sensor was positioned 1/8″ above a whiteboard-like surface with a 3/4″ thick piece of black electrical tape on it. The first reading was taken over the white portion of the surface, the second reading was taken at the edge of the tape, and the third was taken while fully over the black tape. The yellow oscilloscope channel is the sensor output and the blue oscilloscope channel is the output of an ATmega168 AVR microcontroller representing its interpretation of the sensor output. A 5 V blue signal indicates that the AVR is measuring the sensor output as “high”; a 0 V blue signal indicates that the AVR is measuring the sensor output as “low”. In an actual application, the important value is the width of the positive blue pulse. As you can see from the screen captures, the shorter the pulse, the more reflective the surface. Medium-width pulses occur from moderately reflective surfaces, or as you transition from a white surface to a black surface (or vice versa).
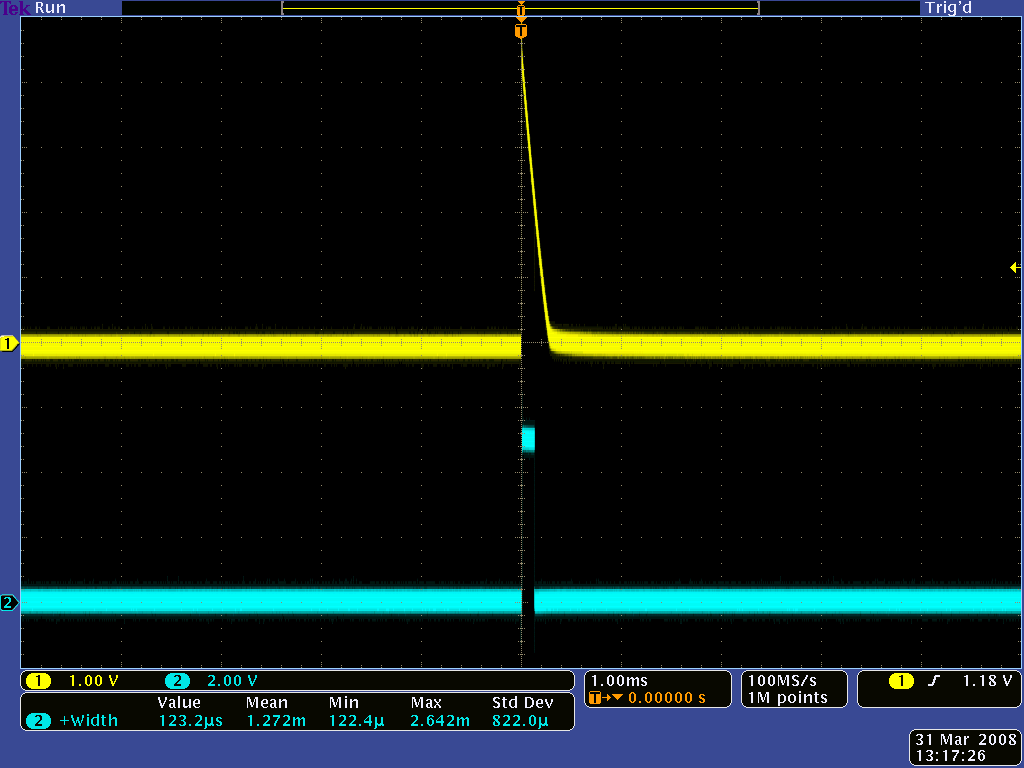 |
QTR-1RC output (yellow) when 1/8" above a white surface and microcontroller timing of that output (blue). |
|---|
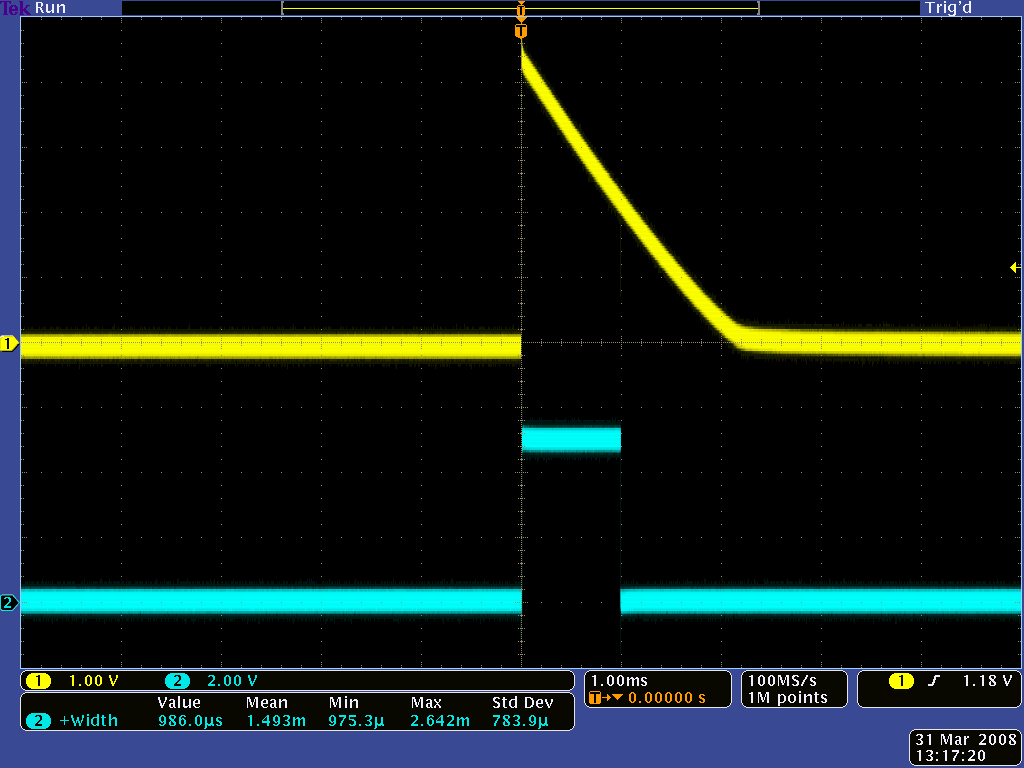 |
QTR-1RC output (yellow) when 1/8" above a white/black interface and microcontroller timing of that output (blue). |
|---|
 |
QTR-1RC output (yellow) when 1/8" above a black line and microcontroller timing of that output (blue). |
|---|
Please note that these data are affected by the specifics of the test. Reflectances depend on the surfaces, and each microcontroller will have its own trip-low threshold. In our specific example, you can see that at a height of 1/8″ above our surface, white results in a high pulse width of 120 μs and black results in a high pulse width of 2.6 ms. As the pulse width varies between 120 μs and 2.6 ms, you can tell that you are approaching or leaving the line.
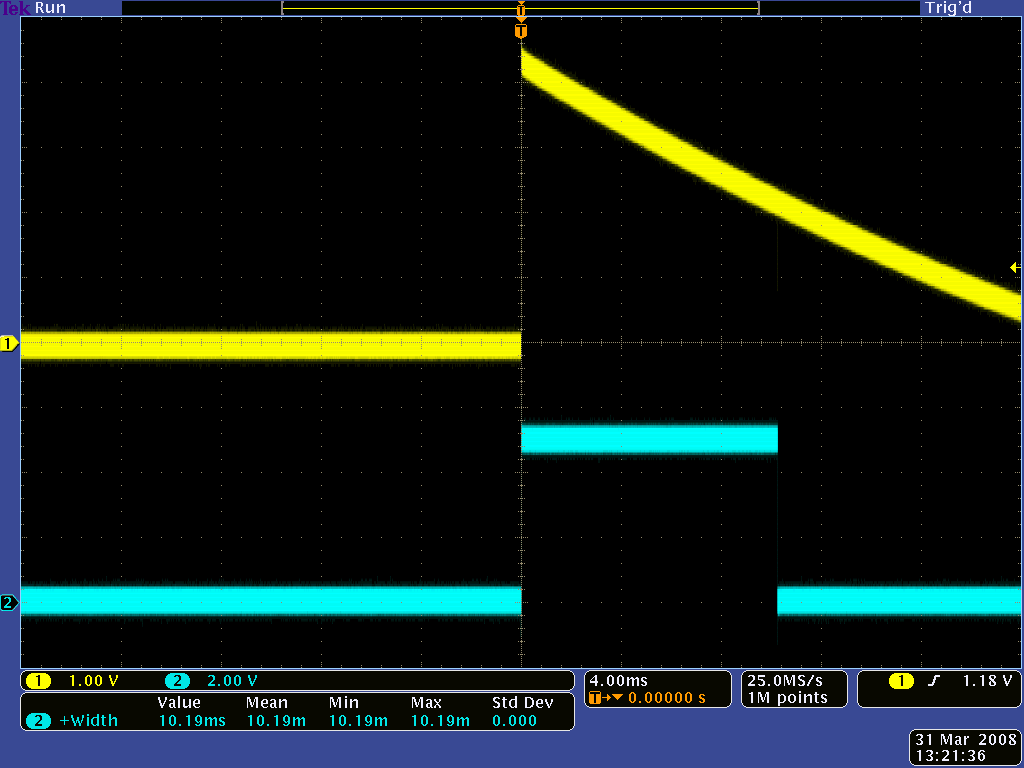
The screen captures below show the results of the same test conducted at a sensor height of 3/8″.
 |
QTR-1RC output (yellow) when 3/8" above a white surface and microcontroller timing of that output (blue). |
|---|
 |
QTR-1RC output (yellow) when 3/8" above a white/black interface and microcontroller timing of that output (blue). |
|---|
 |
QTR-1RC output (yellow) when 3/8" above a black line and microcontroller timing of that output (blue). |
|---|
Raising the sensor decreases the overall reflectance of the surface, which in turn lengthens all of the positive pulse widths. This means we need more time to measure the sensor outputs and hence we are limited to lower update rates. At this height, our white surface results in a high pulse width of 780 μs and our black surface results in a high pulse width of 10 ms.
Note that at the start of each yellow pulse, there is a 10 μs period where our microcontroller is driving the sensor output line high.
Lastly, the following screen capture shows an example of what the sensor output might look like as it sweeps across a black line on a white surface. A motor was used to rotate a white paper disk with a piece of black electrical tape on it in front of the sensor. The electrical noise present in the screen capture is from this motor. If you will be using these sensors in electrically noisy environments (e.g. around motors), you should filter the signal either with a low-pass filter circuit or in your microcontroller software. For example, when timing the high (blue) pulse, wait until the signal stays low for a minimum duration (e.g. 10 μs) before accepting the low signal as the end of the pulse.
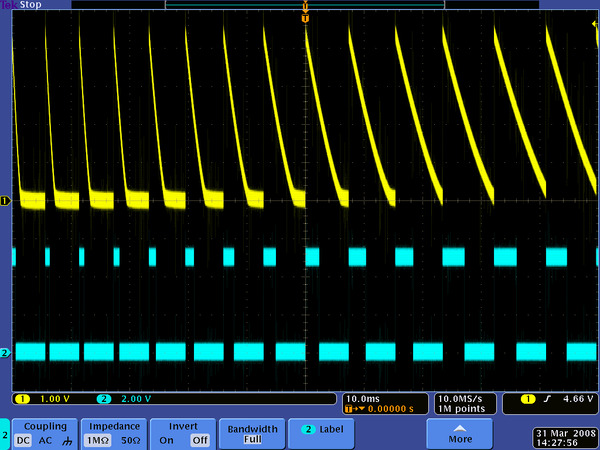 |
Example series of QTR-1RC output signals generated as a black line on a spinning white disk passes in front of the sensor. |
|---|
Related products


Home | Forum | Blog | Support | Ordering Information | Lists | Distributors | BIG Order Form | About | Contact
© 2001–2026 Pololu Corporation