Support »
Pololu QTR Reflectance Sensor Application Note
View document on multiple pages.
You can also view this document as a printable PDF.
- 1. Introduction
- 2. RC-type sensor output (intended for digital I/Os)
- 3. A-type sensor output (analog voltages)
- 4. Second-generation QTR/QTRX sensor array details
- 5. Related resources
1. Introduction
The Pololu QTR reflectance sensors can be used to sense how much infrared light is reflected from a nearby surface. The QTR sensors are intended to be used as line sensors in line-following, maze-solving, and sumo robots, but they can be used as general purpose proximity or reflectance sensors. They are available in two output types:
- RC-type sensors can be read by timing a signal on a digital I/O line.
- A-type sensors output an analog voltage.
This application note explains how both types of sensors work and what their output signals look like.
First- and second-generation QTR sensors
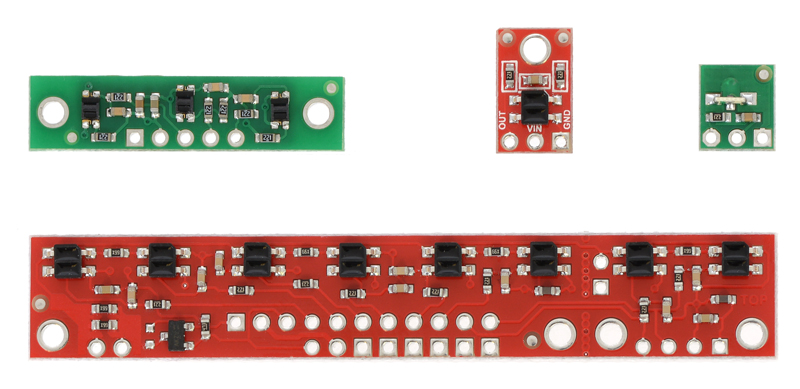
Our older (first-generation) QTR sensors, introduced prior to August 2018, mostly have red and green PCBs. These sensor boards do not have integrated LED drivers, so their emitter brightness depends on the supply voltage.
 |
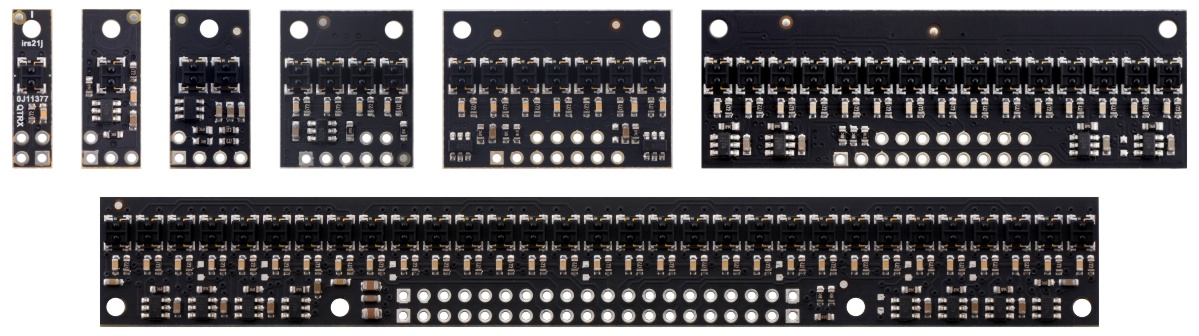
Our newer (second-generation) QTR and QTRX sensors have black PCBs and feature integrated LED drivers that provide brightness control independent of the supply voltage and optional dimming to any of 32 possible brightness settings. They are available in a wide range of sizes and in High-Density (4 mm pitch) and Medium-Density (8 mm pitch) versions; HD arrays with five or more sensors additionally provide separate control of the odd-numbered and even-numbered LEDs for greater versatility.
 |
The information about sensor output types in Section 2 and Section 3 applies to both the first- and second-generation sensor boards. Section 4 explains details specific to the second-generation QTR/QTRX sensors.
2. RC-type sensor output (intended for digital I/Os)
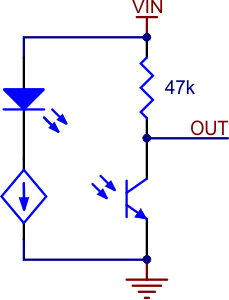
Each RC-type output is tied to a capacitor discharge circuit as shown below. Different QTR sensor products have different component values, and exact schematics for each QTR sensor can be found on its product page.
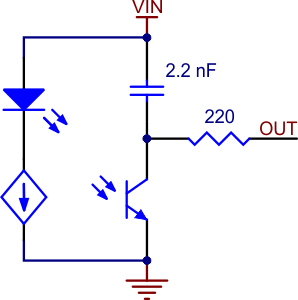 |
Schematic diagram of an individual QTR sensor channel on an RC-type board. This applies only to the newer QTRs with dimmable emitters. |
|---|
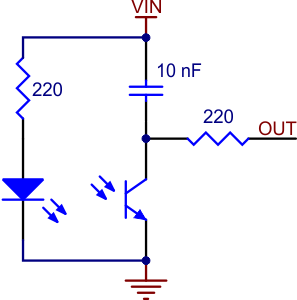 |
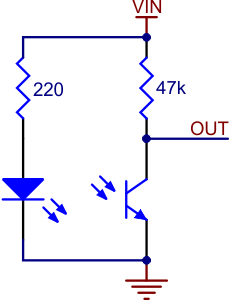
QTR-1RC and QTR-L-1RC reflectance sensor schematic diagram. |
|---|
To use the sensor, you must first charge the output node by applying a voltage to the OUT pin. You can then read the reflectance by withdrawing that externally applied voltage on the OUT pin and timing how long it takes the output voltage to decay due to the integrated phototransistor. Shorter decay time is an indication of greater reflection. This measurement approach has several advantages, especially when multiple units are used:
- No analog-to-digital converter (ADC) is required
- Improved sensitivity over voltage-divider analog output
- Parallel reading of multiple sensors is possible with most microcontrollers.
When you have a microcontroller’s digital I/O connected to a sensor output, the typical sequence for reading that sensor is:
- Set the I/O line to an output and drive it high.
- Allow at least 10 μs for the sensor output to rise.
- Make the I/O line an input (high impedance).
- Measure the time for the voltage to decay by waiting for the I/O line to go low.
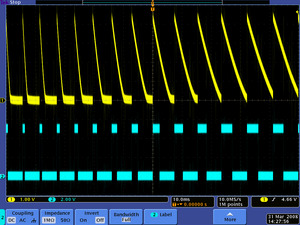
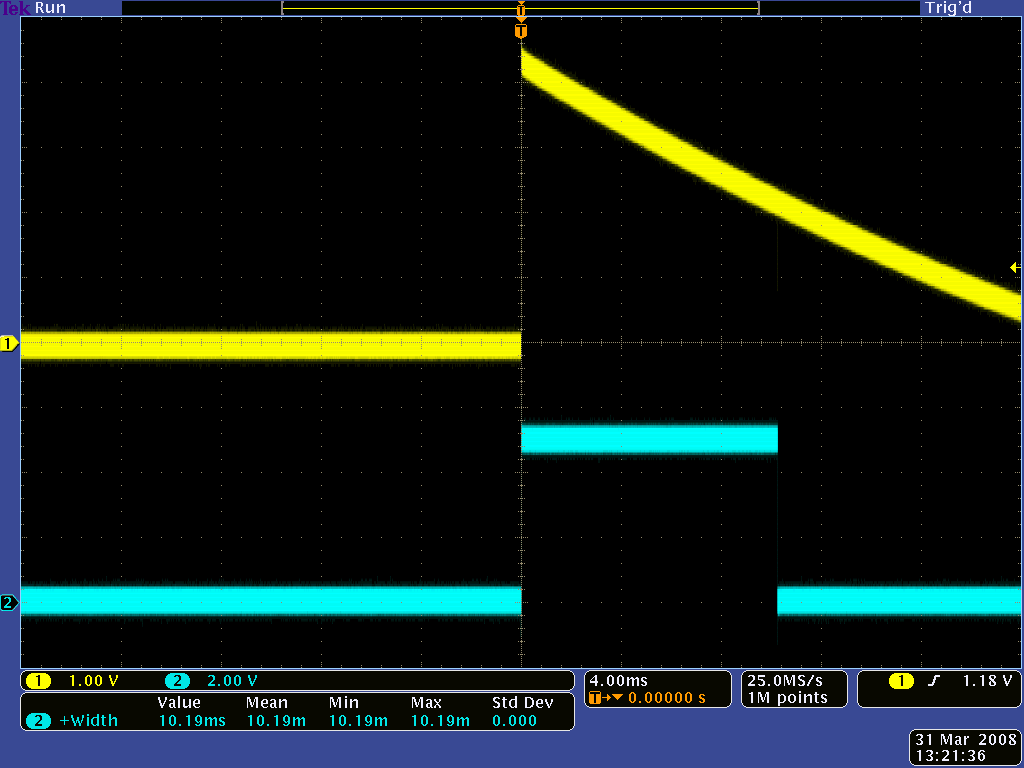
The following three oscilloscope screen captures below demonstrate the result of this procedure. A QTR-1RC sensor was positioned 1/8″ above a whiteboard-like surface with a 3/4″ thick piece of black electrical tape on it. The first reading was taken over the white portion of the surface, the second reading was taken at the edge of the tape, and the third was taken while fully over the black tape. The yellow oscilloscope channel is the sensor output and the blue oscilloscope channel is the output of an ATmega168 AVR microcontroller representing its interpretation of the sensor output. A 5 V blue signal indicates that the AVR is measuring the sensor output as “high”; a 0 V blue signal indicates that the AVR is measuring the sensor output as “low”. In an actual application, the important value is the width of the positive blue pulse. As you can see from the screen captures, the shorter the pulse, the more reflective the surface. Medium-width pulses occur from moderately reflective surfaces, or as you transition from a white surface to a black surface (or vice versa).
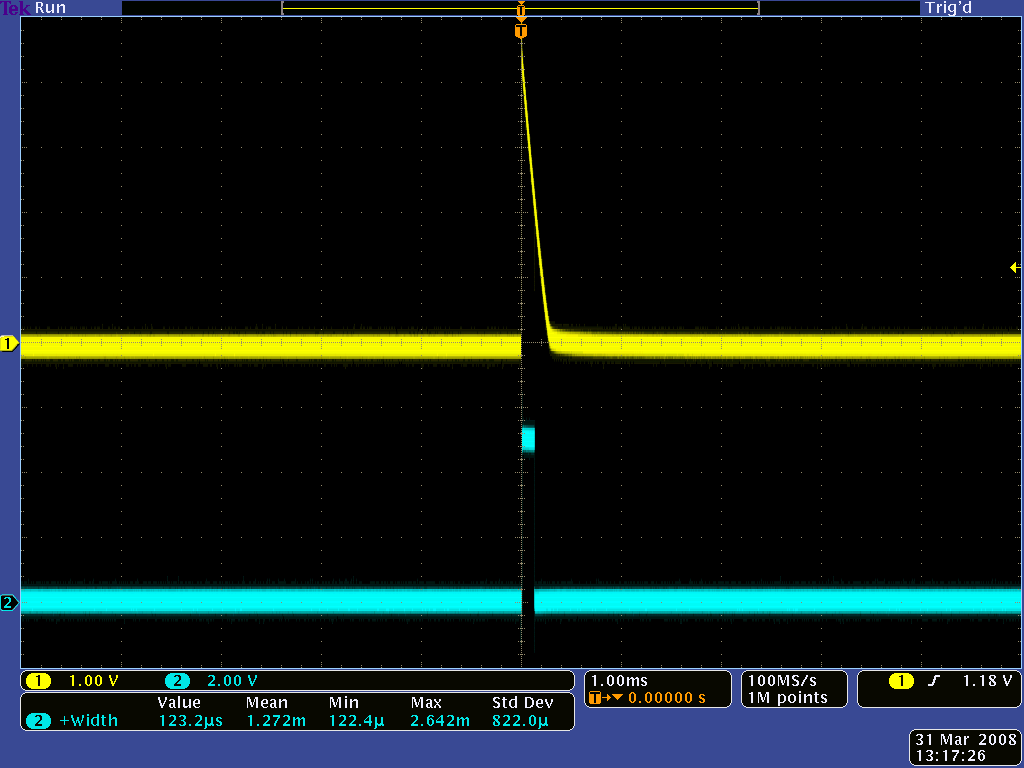 |
QTR-1RC output (yellow) when 1/8" above a white surface and microcontroller timing of that output (blue). |
|---|
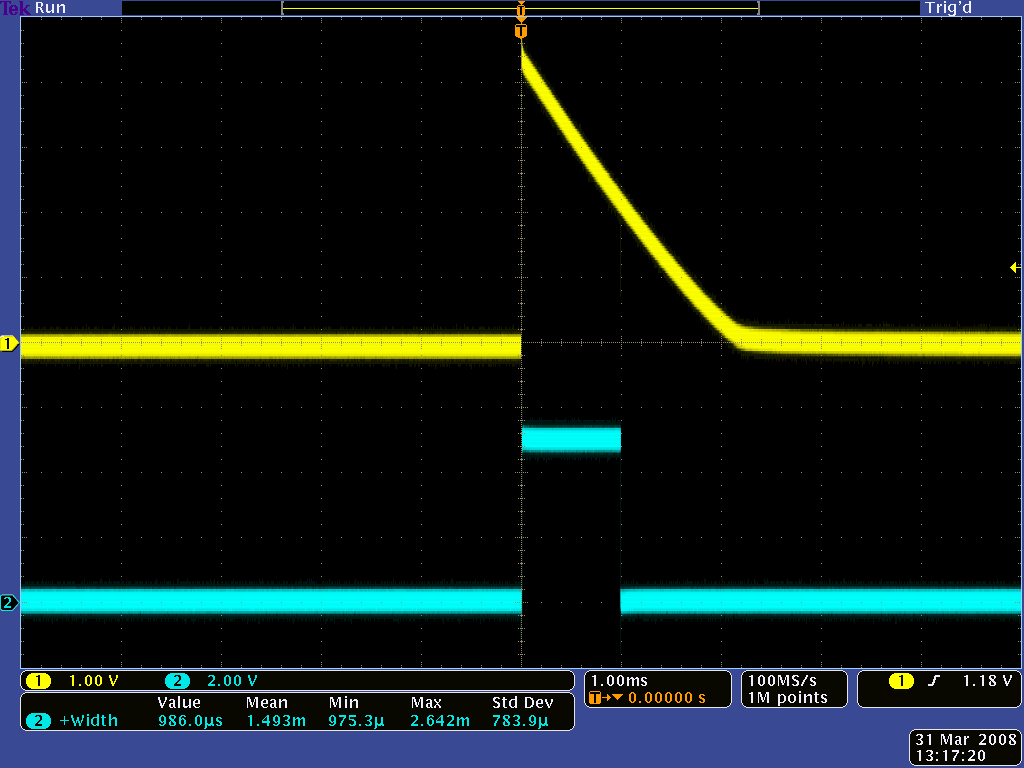 |
QTR-1RC output (yellow) when 1/8" above a white/black interface and microcontroller timing of that output (blue). |
|---|
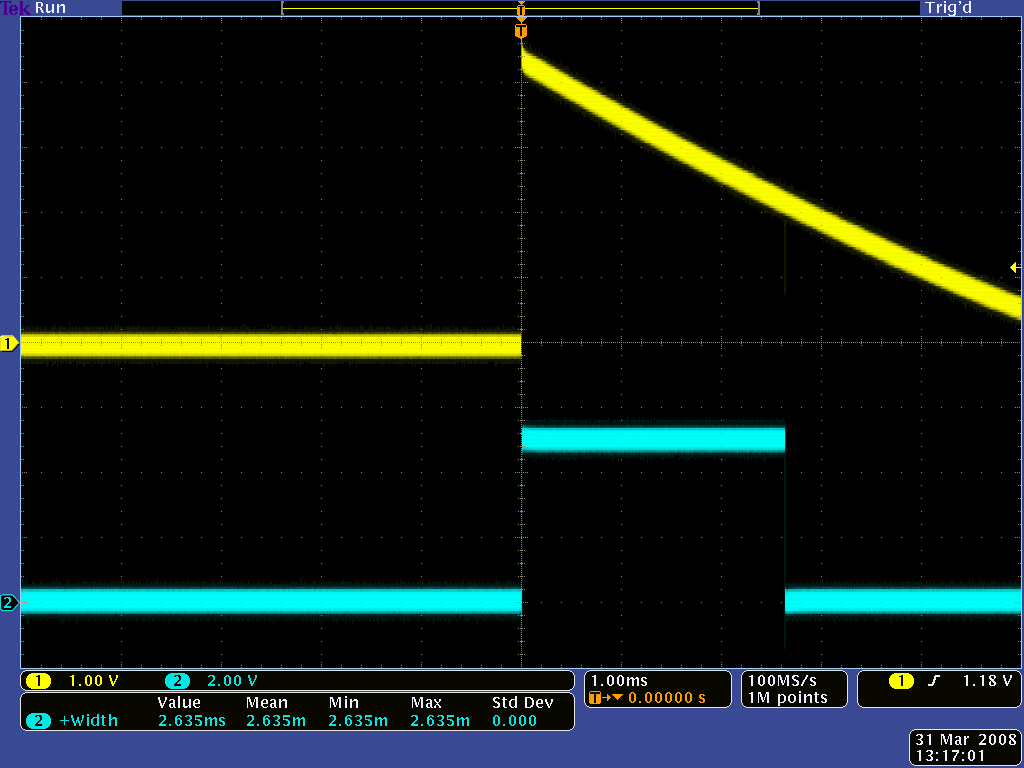 |
QTR-1RC output (yellow) when 1/8" above a black line and microcontroller timing of that output (blue). |
|---|
Please note that these data are affected by the specifics of the test. Reflectances depend on the surfaces, and each microcontroller will have its own trip-low threshold. In our specific example, you can see that at a height of 1/8″ above our surface, white results in a high pulse width of 120 μs and black results in a high pulse width of 2.6 ms. As the pulse width varies between 120 μs and 2.6 ms, you can tell that you are approaching or leaving the line.
The screen captures below show the results of the same test conducted at a sensor height of 3/8″.
 |
QTR-1RC output (yellow) when 3/8" above a white surface and microcontroller timing of that output (blue). |
|---|
 |
QTR-1RC output (yellow) when 3/8" above a white/black interface and microcontroller timing of that output (blue). |
|---|
 |
QTR-1RC output (yellow) when 3/8" above a black line and microcontroller timing of that output (blue). |
|---|
Raising the sensor decreases the overall reflectance of the surface, which in turn lengthens all of the positive pulse widths. This means we need more time to measure the sensor outputs and hence we are limited to lower update rates. At this height, our white surface results in a high pulse width of 780 μs and our black surface results in a high pulse width of 10 ms.
Note that at the start of each yellow pulse, there is a 10 μs period where our microcontroller is driving the sensor output line high.
Lastly, the following screen capture shows an example of what the sensor output might look like as it sweeps across a black line on a white surface. A motor was used to rotate a white paper disk with a piece of black electrical tape on it in front of the sensor. The electrical noise present in the screen capture is from this motor. If you will be using these sensors in electrically noisy environments (e.g. around motors), you should filter the signal either with a low-pass filter circuit or in your microcontroller software. For example, when timing the high (blue) pulse, wait until the signal stays low for a minimum duration (e.g. 10 μs) before accepting the low signal as the end of the pulse.
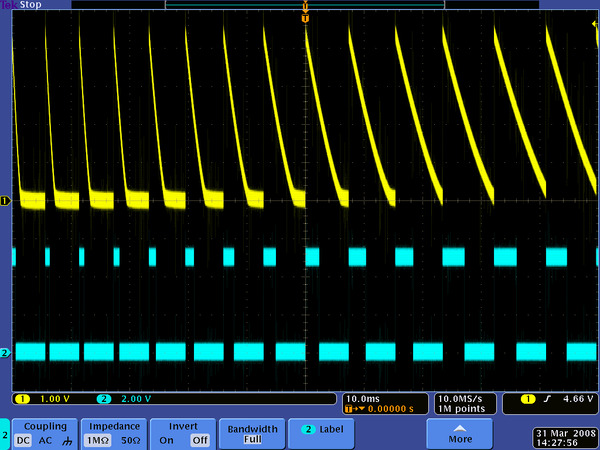 |
Example series of QTR-1RC output signals generated as a black line on a spinning white disk passes in front of the sensor. |
|---|
3. A-type sensor output (analog voltages)
Each A-type reflectance sensor phototransistor output is connected to a pull-up resistor as shown below to form a voltage divider that produces an analog voltage output that ranges between 0 V and the supplied voltage (which is typically 5 V). With a strong reflectance, such as when the sensor is over a white surface, its output voltage will tend towards 0 V; with very weak reflectance, such as when the sensor is over a black surface, its output voltage will tend towards the supplied voltage. Different QTR sensor products have different component values, and exact schematics for each QTR sensor can be found on its product page.
 |
Schematic diagram of an individual QTR sensor channel on an A-type board. This applies only to the newer QTRs with dimmable emitters. |
|---|
 |
QTR-1A reflectance sensor schematic diagram. |
|---|
To demonstrate what the A-type sensor output looks like as it passes from a reflective surface to a non-reflective surface and back again, we set up a motor to spin a white paper circle with a piece of black electrical tape on it as shown below.
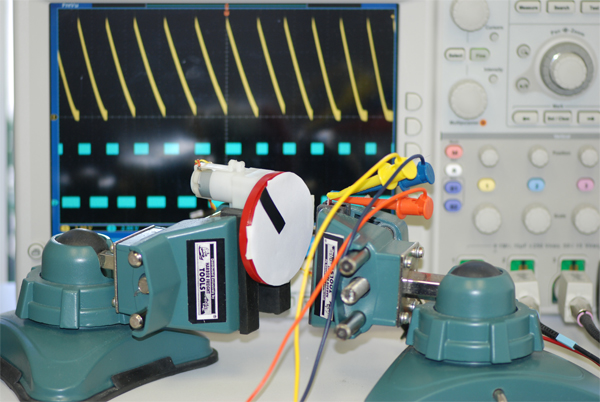 |
Experimental setup for QTR-1A and QTR-1RC oscilloscope outputs. |
|---|
The following three oscilloscope screen captures show the output of the QTR-1A reflectance sensor during the period where the black line passes by the sensor. The oscilloscope is set to 500 mV per division. The only difference between the three captures is the distance from the sensor to the disk: ~1/8″ in the first capture, ~1/4″ in the second capture, and ~3/8″ in the third capture.
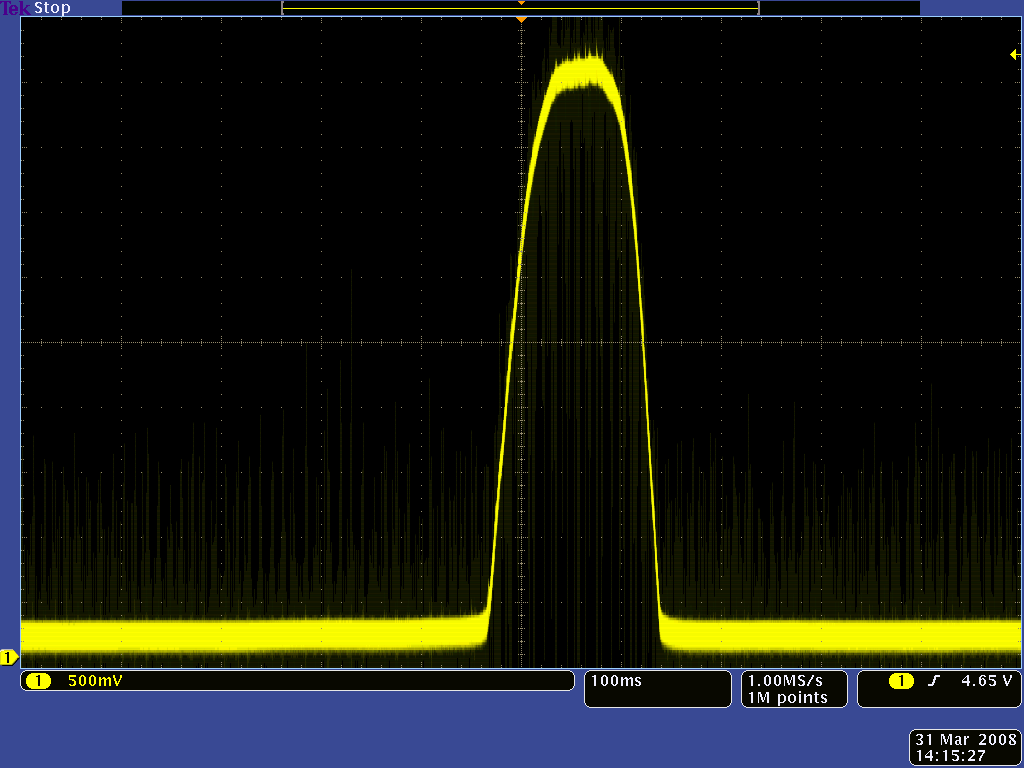 |
QTR-1A output 1/8" away from a spinning white disk with a black line on it. |
|---|
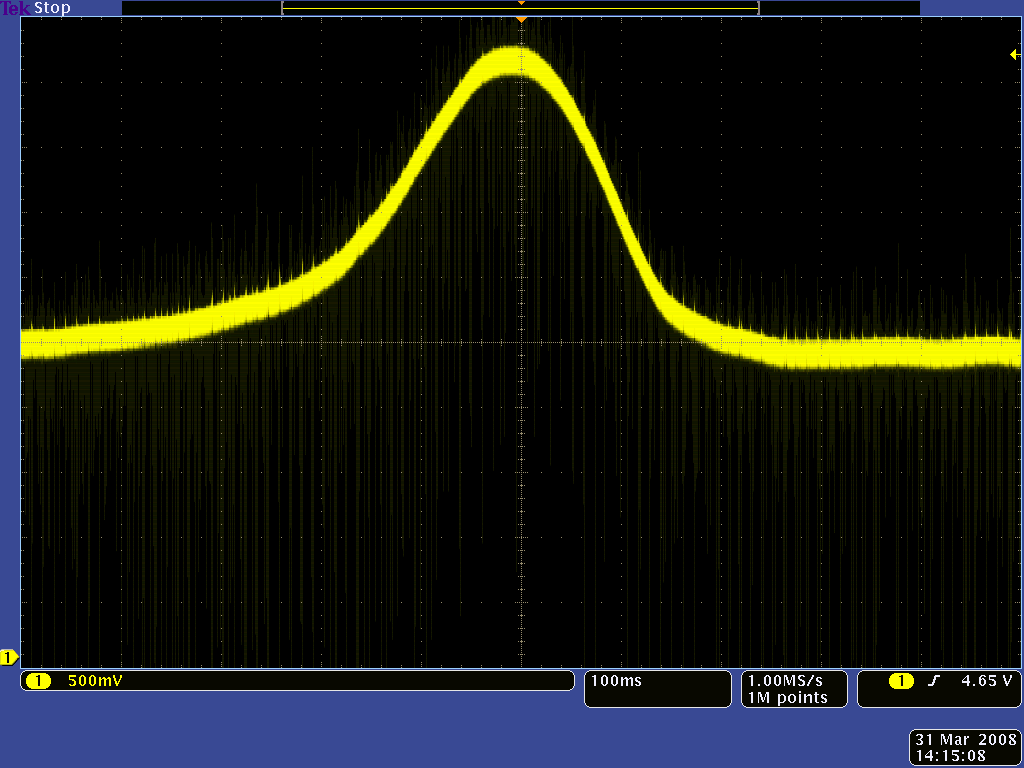 |
QTR-1A output 1/4" away from a spinning white disk with a black line on it. |
|---|
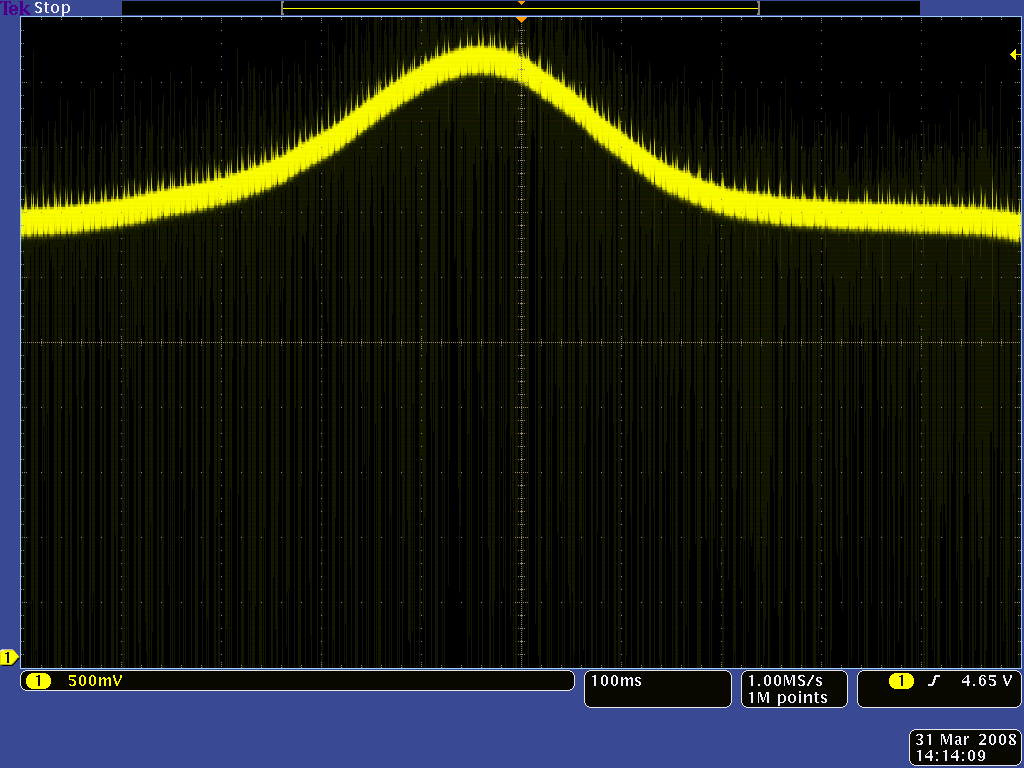 |
QTR-1A output 3/8" away from a spinning white disk with a black line on it. |
|---|
As the distance between the sensor and the surface increases, the overall reflectance decreases and the total range of the sensor output decreases. At a distance of 1/8″, the difference between the white surface and the black surface is around 4.5 V. At a distance of 3/8″, the difference between the white surface and the black surface has decreased to around 1.2 V, which makes distinguishing between the two surfaces much harder and much more prone to error caused by noise or changes in lighting conditions.
Note that in these captures you can clearly see the effect of the motor’s noise on the output signal. This underscores the importance of filtering your sensor output if it will be in a potentially noisy environment, either by using a low-pass filter circuit or by averaging several sensor readings together.
4. Second-generation QTR/QTRX sensor array details
Sensor options
Two different sensor options are available on our second-generation reflectance sensor arrays, denoted by “QTR” or “QTRX” in the product name. The QTR versions feature lower-cost sensor modules without lenses while the QTRX versions feature higher-performance sensor modules with lenses, which allow similar performance at a much lower IR LED current. You can see the two different sensor styles in the pictures below of the 4-channel modules:
|
|
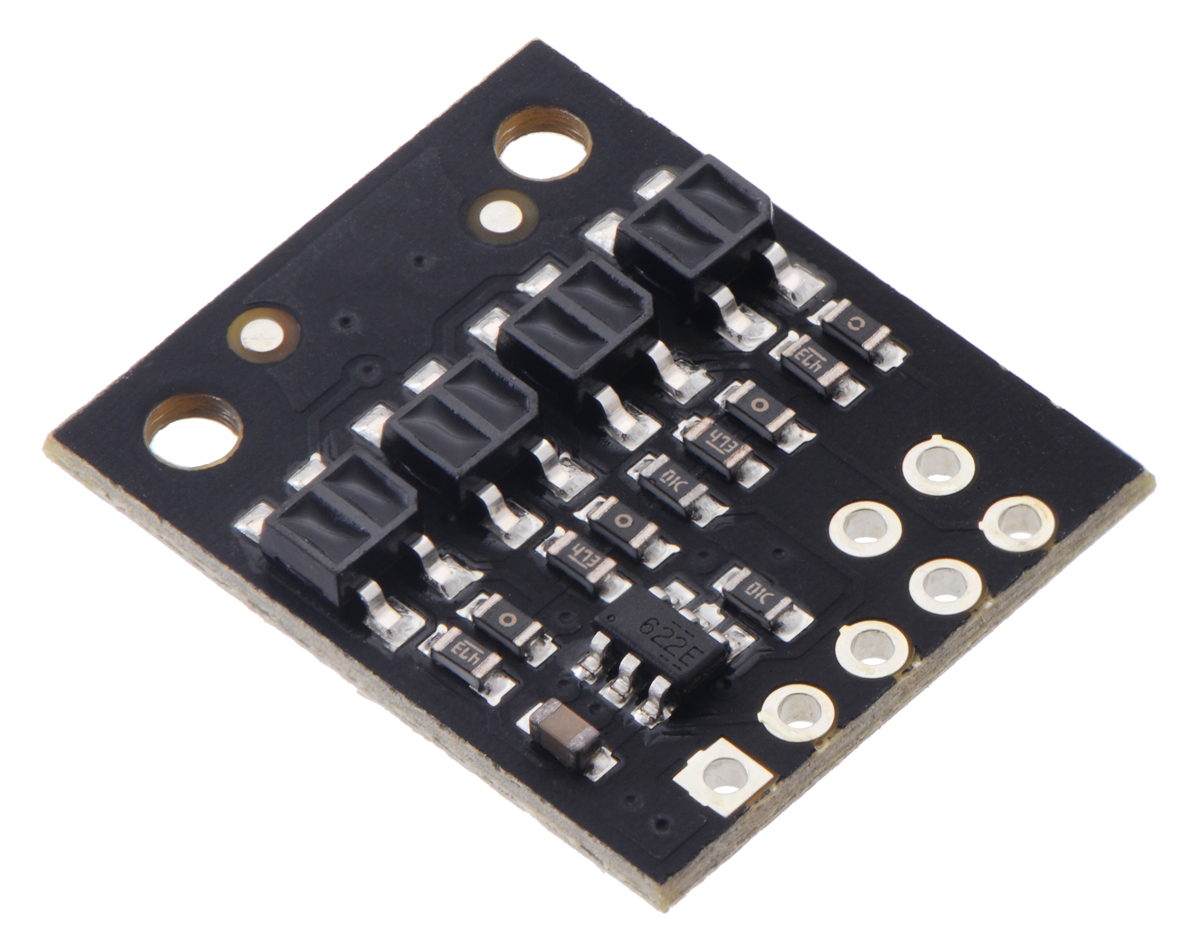
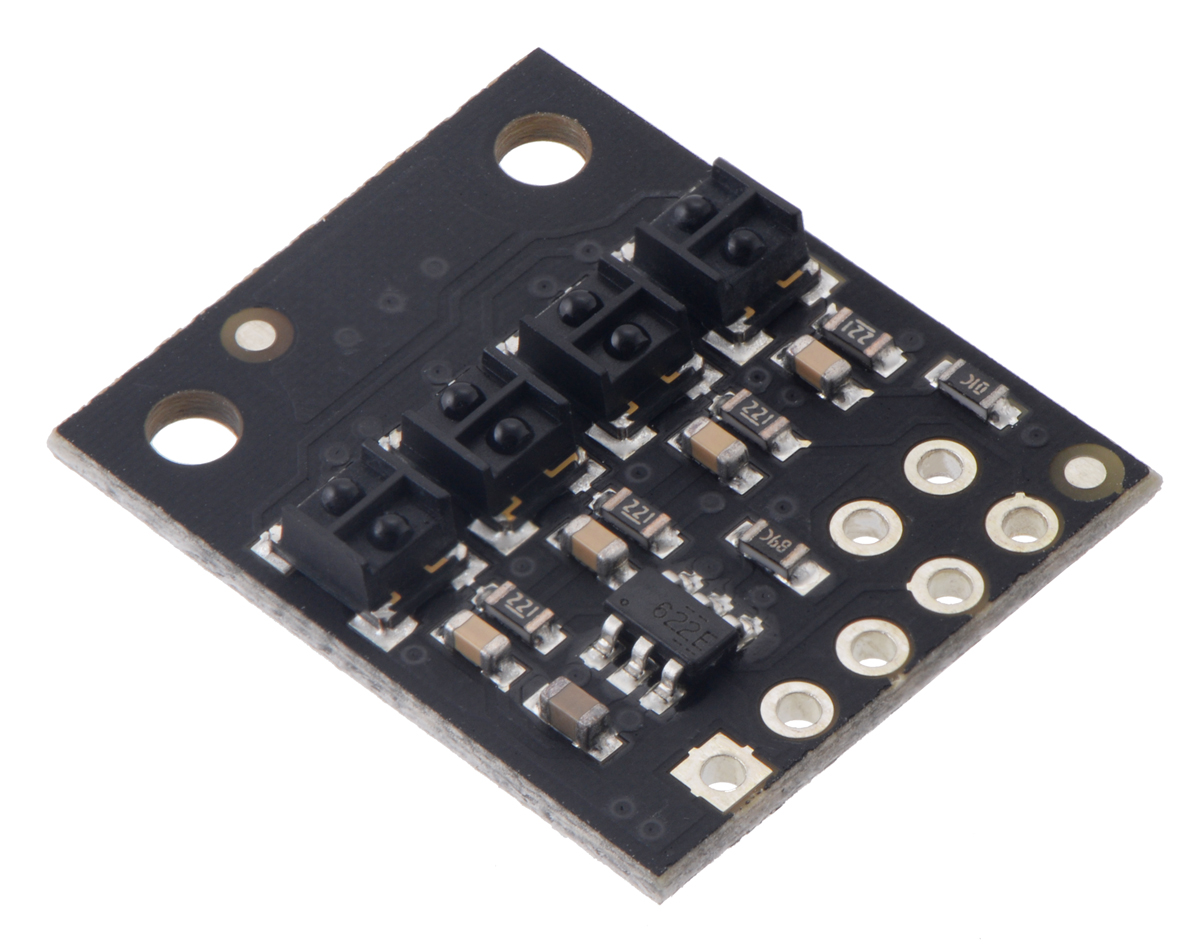
A disadvantage of the QTRX sensor modules is that they leak light out the sides and can interfere with each other when they are closely spaced (unless barriers are added between the sensors). Consequently, the maximum emitter current on QTRX arrays is set low enough to limit the interference while optimizing their useful range. This is not an issue with a single sensor, so we offer high-brightness QTRXL versions of the 1-channel boards in addition to the normal-brightness QTRX versions, but it is still important to consider interference when using multiple 1-channel boards.
This video (taken with an old camera that does not have as much IR filtering as most newer cameras) shows the IR light leakage around the side of the QTRX sensor module:
Emitter control
The second-generation reflectance sensor arrays maintain a constant current through their IR emitters, keeping the emitters’ brightness constant, independent of the supply voltage (2.9 V to 5.5 V). The emitters can be controlled with the board’s CTRL pins, and the details of the control depends on the array size and density:
- Units with five or more sensors in a high-density (HD) arrangement have two emitter control pins: CTRL ODD and CTRL EVEN. By default, these are connected together with a 1 kΩ resistor and pulled up, turning on all the emitters by default and allowing them to be controlled with a signal on either pin, but the CTRL ODD and CTRL EVEN pins can be driven separately for independent control of the odd-numbered and even-numbered emitters.
- Units with three or more sensors in a medium-density (MD) arrangement also have two emitter control pins since these are made by only populating every other sensor on an HD board, but only the CTRL ODD pin will have an effect on these versions (it is not possible to independently control alternate emitters).
- Units with four or fewer sensors have a single CTRL pin that controls all of the emitters.
Driving a CTRL pin low for at least 1 ms turns off the associated emitter LEDs, while driving it high (or allowing the board to pull it high) turns on the emitters with the board’s default (full) LED current, which is 30 mA for QTR and QTRXL boards and 3.5 mA for QTRX boards. (The emitter LEDs are generally driven in pairs, with the two emitters in each pair connected in series, so the total board current is not the LED current times the number of LEDs as you might otherwise expect; it is usually closer to half that.)
|
|
For more advanced use, the CTRL pin can be pulsed low to cycle the associated emitters through 32 dimming levels. To send a pulse, you should drive the CTRL pin low for at least 0.5 μs (but no more than 300 μs), then high for at least 0.5 μs; (it should remain high after the last pulse). Each pulse causes the driver to advance to the next dimming level, wrapping around to 100% after the lowest-current level. Each dimming level corresponds to a 3.33% reduction in current, except for the last three levels, which represent a 1.67% reduction, as shown in the table below. Note that turning the LEDs off with a >1 ms pulse and then back on resets them to full current.
| Dimming level (pulses) |
Emitter current (%) |
Dimming level (pulses) |
Emitter current (%) |
|
|---|---|---|---|---|
| 0 | 100.00% | 16 | 46.67% | |
| 1 | 96.67% | 17 | 43.33% | |
| 2 | 93.33% | 18 | 40.00% | |
| 3 | 90.00% | 19 | 36.67% | |
| 4 | 86.67% | 20 | 33.33% | |
| 5 | 83.33% | 21 | 30.00% | |
| 6 | 80.00% | 22 | 26.67% | |
| 7 | 76.67% | 23 | 23.33% | |
| 8 | 73.33% | 24 | 20.00% | |
| 9 | 70.00% | 25 | 16.67% | |
| 10 | 66.67% | 26 | 13.33% | |
| 11 | 63.33% | 27 | 10.00% | |
| 12 | 60.00% | 28 | 6.67% | |
| 13 | 56.67% | 29 | 5.00% | |
| 14 | 53.33% | 30 | 3.33% | |
| 15 | 50.00% | 31 | 1.67% |
For example, to reduce the emitter current to 50%, you would apply 15 low pulses to the CTRL pin and then keep it high after the last pulse.
5. Related resources
More information about the Pololu QTR sensors can be found in these resources:
- Pololu QTR Reflectance Sensors category: This is where you can find all the QTR sensors we offer.
- Arduino Library for the Pololu QTR Reflectance Sensors
- Pololu 3pi robot: A user-programmable robot with integrated QTR sensors.
- Zumo Reflectance Sensor Array: A QTR sensor array for our Zumo robot.
- Pololu AVR C/C++ Library User’s Guide: This library for our Orangutan robot controllers has functions for reading QTR sensors.
- QTR-8A and QTR-8RC Reflectance Sensor Array User’s Guide
Related products


Home | Forum | Blog | Support | Ordering Information | Wish Lists | Distributors | BIG Order Form | About | Contact
© 2001–2024 Pololu Corporation